Dr.Gary Dayton – Point & Figure Charting
$39.00
- Description
Description
Author: Dr.Gary Dayton
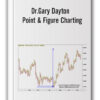
Point & Figure Charting
Sale Page : tradingpsychologyedge
This product is available
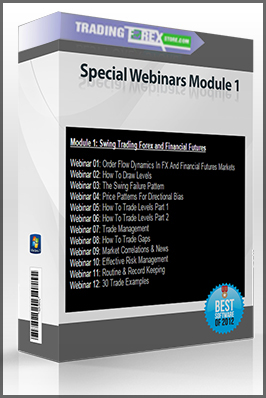
Over four hours of teaching over 2 sessions
Smart traders know when a market is ready to take off. Just as important, they know how far that move is likely to run. When you get into a trade, do you have a clear idea of where it is likely to go? Do you close trades prematurely or hold them too long because you really don’t know the target? Can you say ahead of time, what your profit objective is? In your studies, do you pay attention to entries and neglect exits? Here is the information to change all that. Imagine how you would feel if you could hold your trades for larger profits and exit them at the right location because you know the trade’s likely target in advance? Well, this is certainly possible.
Point & Figure assessment targets a recent 20-point decline in an American stock. Savvy traders knew not only that the market was ripe for a decline, but that it was a choice opportunity with a sizable target. This tutorial teaches you in detail how to read this and other great opportunities.
Every trader would like to be able to exit their trades at the right location. Once the move has spent its energy, it’s time to take full profits. Few traders know how to do this. They exit too soon or they hold onto the trade thinking there is more to come. Frustrated, they give up large profits.
In their frustration, traders try all kinds of different things to correct their mistakes, but there is only one tool that clearly tells a trade’s target objective: The Point & Figure Chart.
The FX Market traders can use Point & Figure Charts, too. A recent large up move in the Cable (GBPUSD) was projected by the P & F within a handful of pips.
Traders need a dependable way to select the best trading opportunities. They also need a reliable tool that highlights accumulation and distribution and to know with good odds the distance a move is likely to run.
They need a tool that:
- Is trustworthy and reliable
- Produces better results
- Is consistent
- Gets you into choice moves near their beginning and gets you out near the end
- Improves your ability to identify accumulation and distribution
- Doesn’t require an indicator, expensive software or fancy calculations
- Shows you clearly where strong support and resistance lie
- Works on all time frames and in all freely traded markets
- Is easily seen and assessed by the trader
Point & Figure Charts are used by swing traders and intraday traders. Here, the P & F Chart captured a recent 30-point intraday move in the S&P e-minis (ES). The P & F Chart highlighted the distribution and gave the target within one point.