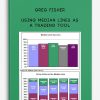
Using Median Lines as a Trading Tool by Greg Fisher
$9.00
- Description
Description
Using Median Lines as a Trading Tool by Greg Fisher
Get Using Median Lines as a Trading Tool by Greg Fisher at bestoftrader.com
Forex Trading – Foreign Exchange Course
You want to learn about Forex?
Foreign exchange, or forex, is the conversion of one country’s currency into another.
In a free economy, a country’s currency is valued according to the laws of supply and demand.
In other words, a currency’s value can be pegged to another country’s currency, such as the U.S. dollar, or even to a basket of currencies.
A country’s currency value may also be set by the country’s government.
However, most countries float their currencies freely against those of other countries, which keeps them in constant fluctuation.
Size 3.4 MB
Dr. Alan Andrews developed a technical market analysis tool called the Median Line and taught the method in the 1960′s and 1970′s. He determined there was a high probability price returned to the Median Line – a line drawn on a stock or futures price chart – after making three alternative price pivots. Dr. Andrews stated in his Action-Reaction course:
“…drawing a single line will enable you to know where the price of any stock or any future is now headed and the probable time it will reach there.” AND, the method would,
“…enable the user to be one of the few who can tell where the prices are headed, and the place they will reach about 80% of the time, and when approximately that place will be reached.”
Which brings a number of questions to mind:
Does such a simple method apply to today’s markets? If so, which markets? Does price return to the Median Line more often than not? What happens when prices NEAR the Median Line? What is the probability prices will reverse and change trend NEAR the Median Line?
When I first found some of Dr. Andrews’ work, I gave it little thought. It seemed simple – TOO simple. Behind the first appearance of simplicity, I quickly found out that there was much more behind Andrews’ words. Most likely SEVERAL years of market study. The method intrigued me, so I set up a study of the Median Line method to put it to the test. I wanted to know if this old fashioned method worked. I extracted some of the major observations Dr. Andrews’ made and used them as a basis for the study. Dr. Andrews’ was an engineer by training and often referred to the probability of prices acting according to his observations. So I thought, why not start there? I determined the probability of price acting according to Dr. Andrews’ observations for a few of the markets I liked watching. What did I find? To be honest with you, it really doesn’t matter what I found. Why? Because I drew the lines on certain charts of certain markets and certain time frames under certain conditions. Would the results I found apply across all markets, all time frames, and all conditions? Perhaps. Could the way I drew the lines differ from the way others would draw the lines – probably. The question I wanted to answer was,
“If the lines were consistently applied to past price charts and that resulted in a given probability, could that probability be used to estimate future price action?”
Obviously, that information would be valuable.The result of my research is documented in, “Using Median Lines As A Trading Tool: An Empirical Study – Grain Markets 1990 – 2005″. My research helped me validate the value of the Median Line method in mapping out market price action. It also helped me understand the claims Dr. Andrews made in his original course and what they TRULY meant.Because I realized the value in a step-by-step systematic approach to testing the method, I wrote, ”Finding High Probability Lines”, so others can follow the same path to better understanding the Median Line method of technical analysis.