Toptradetools – TOP Swing Reversal Candles 2023
$59.00
- Description
Description
Toptradetools -TOP Swing Reversal Candles
Sale page : Toptradetools -TOP Swing Reversal Candles
Get Toptradetools -TOP Swing Reversal Candles on bestoftrader.com
Swing Reversal Candles
Includes Swing Reversal Candles Indicator | Swing PCT Indicator | Mastering Swing Trading Japanese Reversal Candles Workshop.
The TOP Swing Reversal Candles indicator is designed to track and plot the top 20 reversal Japanese Candlestick Patterns identified by Mark Helweg. Each candlestick pattern has been screened to help traders effectively identify cycle swing reversals in today’s volatile markets.
Finding where cycle tops and cycle bottoms are likely to occur is one of the biggest advantages in trading.
Whether you trade stocks, options, futures, or forex markets, when you can accurately predict key turning points in the markets you hold a significant advantage in trading. TOP Swing Reversal Candles is a powerful indicator that tracks and plots the top 20 uniquely selected Japanese Reversal Candlestick patterns right on your chart.
Many traders feel that Japanese candlestick patterns are some of the best chart patterns to track and trade. With over 20 years of trading experience, Mark Helweg has gone through and painstakingly reviewed the original Japanese candlestick pattern rules originated by the wealthy rice traders on the Osaka Rice Exchange from the 1700s.
Japanese candlesticks are one of the first successful examples of technical chart pattern analysis in the trading world. Even up until the late 1900s, there was little known about these powerful chart patterns because most of the rules surrounding these patterns were still in the original Japanese language. Since that time, a number of chart technicians have translated the original rules surrounding these chart patterns from the Japanese language.
Several of these chart analysts have gone on to publish their works to the western trading world.
Confirming Market Bottoms
The TOP Swing Reversal Candles tracks 10 bullish (and 10 bearish) Japanese candlestick patterns that can be effective used to identify price bottoms or cycle lows. In the chart below, you can see an example of a Doji Morning Start bullish Japanese candlestick pattern. When this pattern occurs, the Japanese rice traders believed that this signified that a price bottom was likely in place. The TOP Swing Reversal Candles indicator has been created by carefully researching the original rules used to track and trade each Japanese candlestick pattern displayed like the Doji Morning Star candlestick pattern in the chart below.
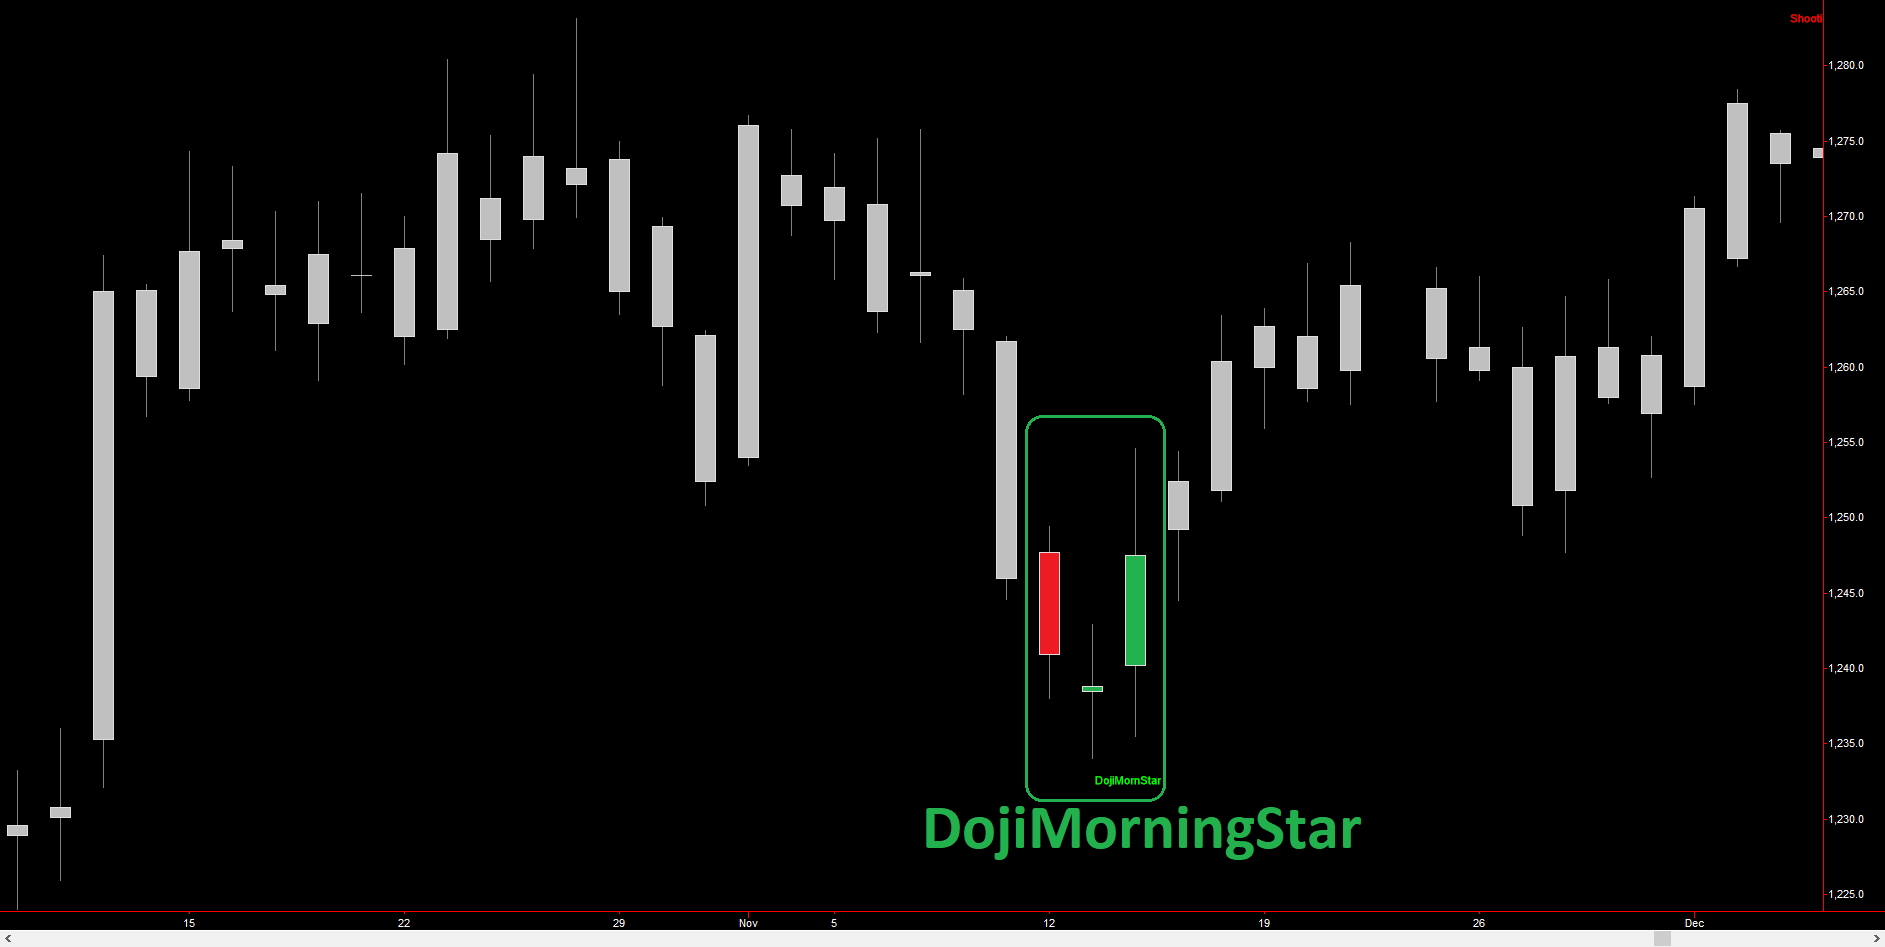
Along with the Doji Morning Star candlestick pattern displayed in the chart above, the TOP Swing Reversal Candles tracks a total of 9 other bullish candlestick patterns designed to help traders identify price bottoms in any market being traded. Candlestick patterns tend to work on all chart timeframes, including intraday charts and end-of-day charts.
Disclaimer: There is a potential for gain and a risk of loss when trading the markets. Past performance is also not necessarily indicative of future results.
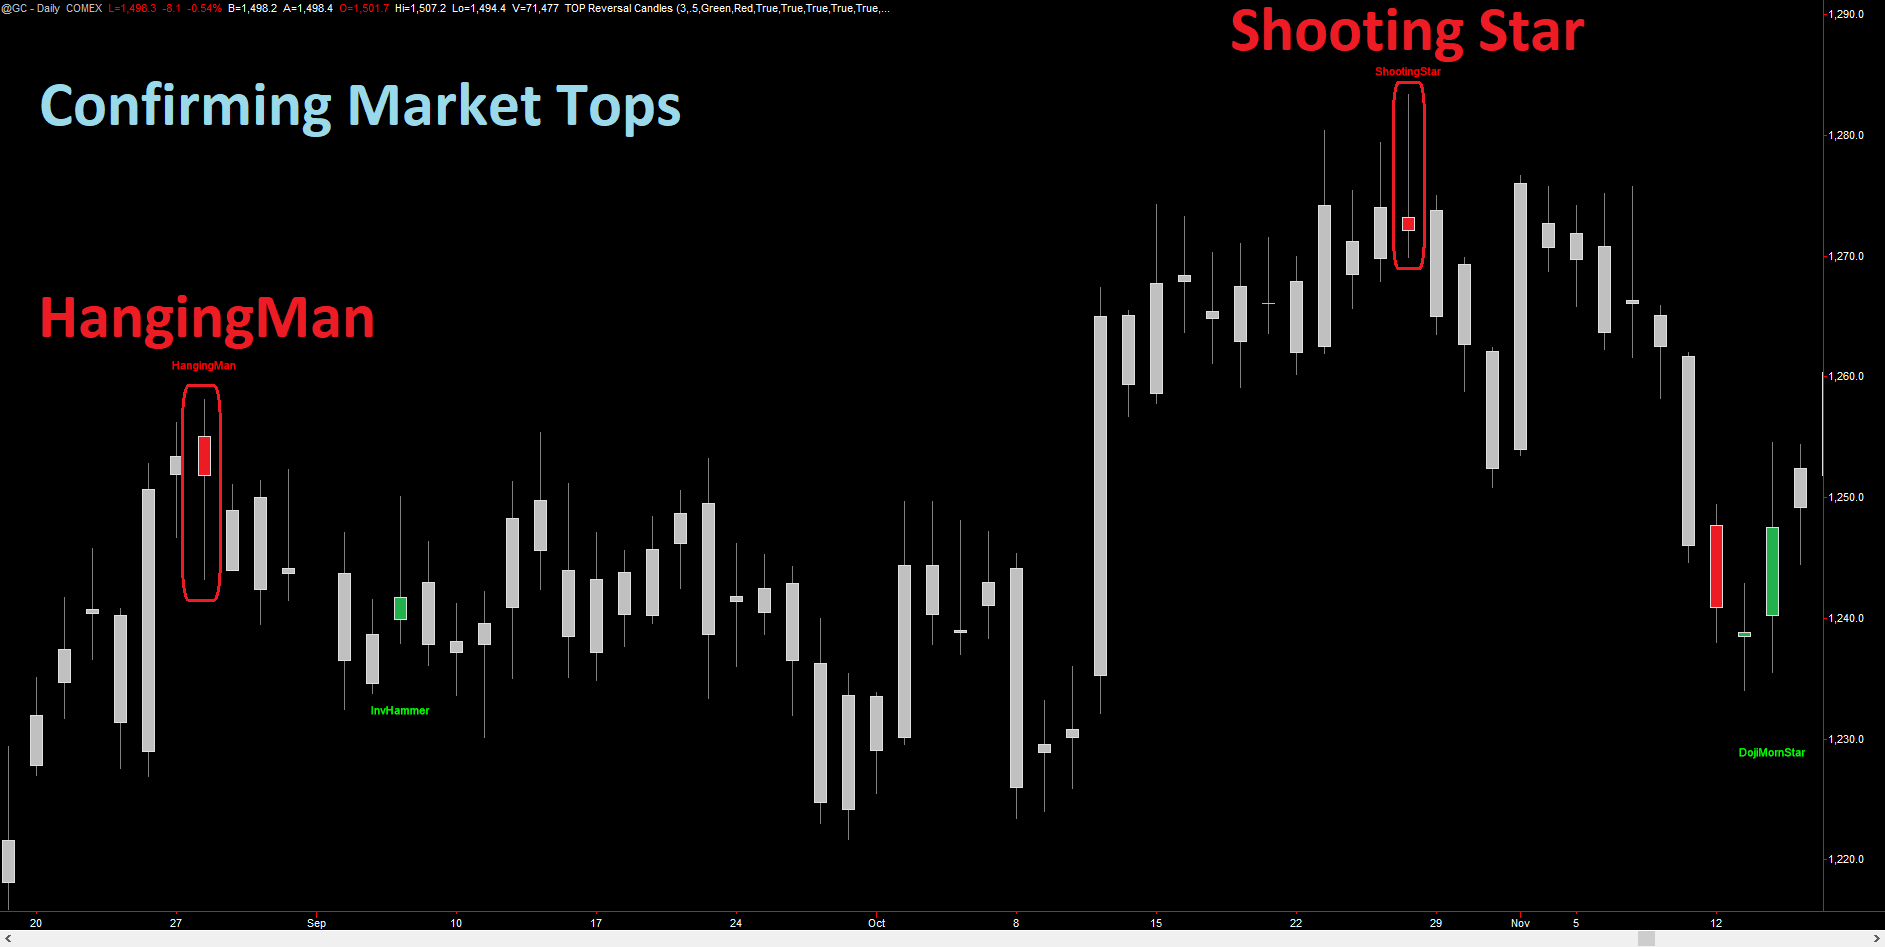
Confirming Market Tops
The TOP Swing Reversal Candles indicator tracks a number (10 bearish candlestick patterns) of bearish candlestick patterns like the bearish Hanging Man candlestick pattern and the bearish Shooting Star candlestick pattern shown in the chart below. These candlestick patterns, among others, can be effective in confirming market cycle top turning points in the markets (see chart below).
“Hand Picked” TOP 20 Candlestick Patterns
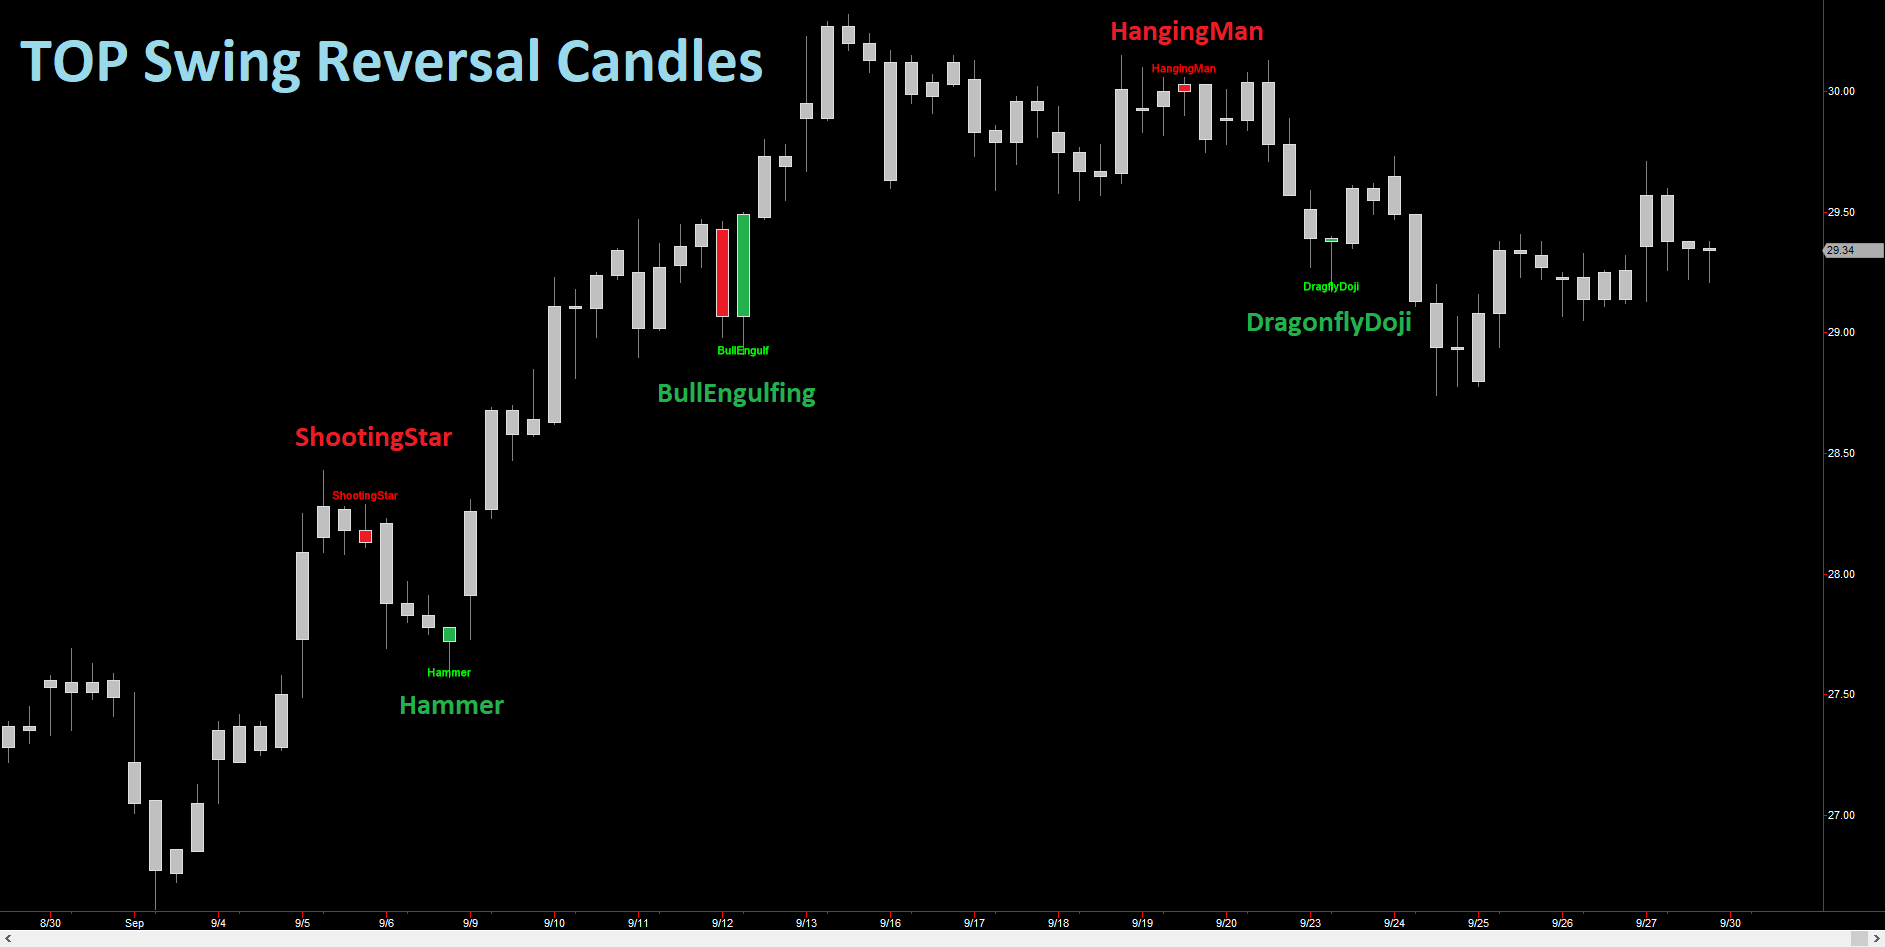
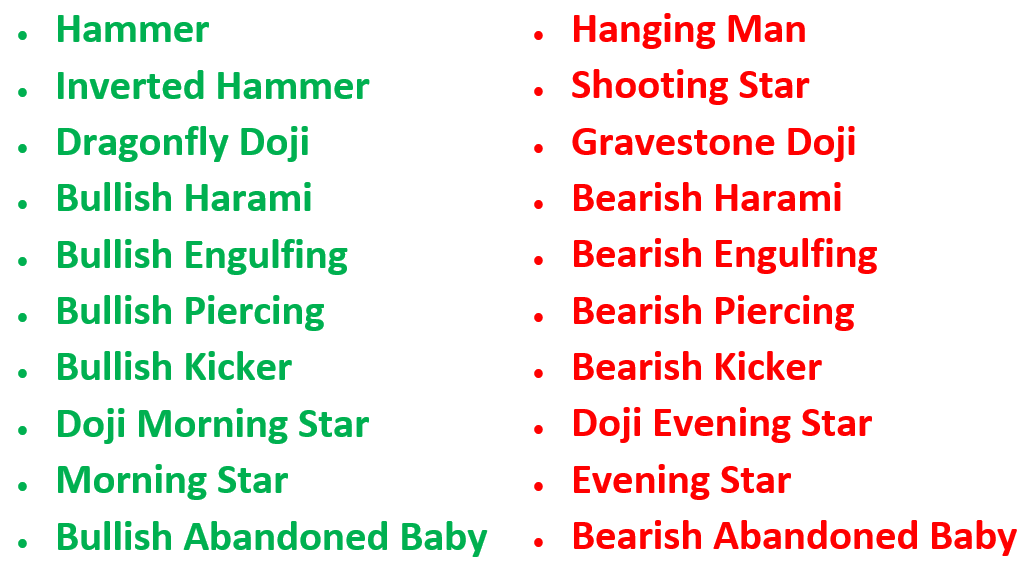
The TOP Swing Reversal Candles indicator tracks what we believe are the top 20 candlestick patterns in the markets. These patterns include both single candlestick patterns like the bullish Hammer Candlestick Pattern and complex three candlestick patterns like the Doji Morning Star pattern seen previously. Japanese candlestick patterns often have the uncanny ability to predict when markets are reversing direction, giving traders a huge potential advantage! The 20 candlestick patterns tracked by the TOP Swing Reversal Candles indicator are displayed below.
Having the ability to auto-identify and plot all of these powerful candlestick reversal patterns on your price charts alerts you to potential market turns. The bullish Japanese candlestick patterns are good for finding higher probability price bottoms and bearish Japanese candlestick patterns are good for finding higher probability price tops. It’s important to note, similar to any chart trading analysis, Japanese candlesticks can generate false patterns over time. Having said that, once you know the rules around confirming these 20 powerful Japanese candlestick patterns, you will be able to quickly identify instances when candlestick patterns become invalid.
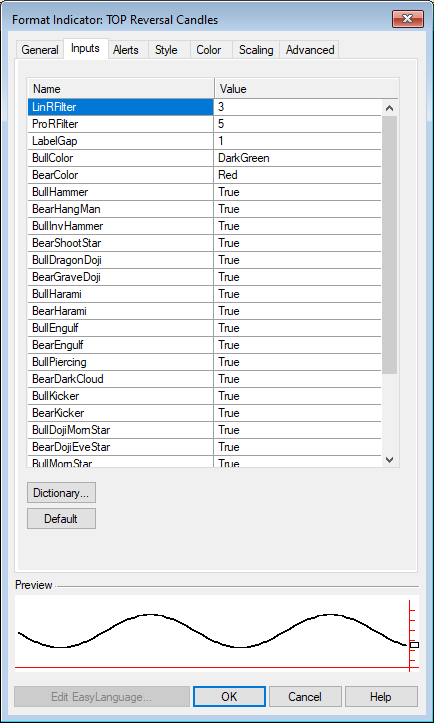
Simple Indicator Settings
We have designed the TOP Swing Reversal Candles indicator to be both powerful and easy to use. The LinRFilter and ProR parameters allows traders to be more or less selective about when to plot reversal Japanese candlestick patterns on their charts based on swing trading principles. Higher values of these parameters create a more selective candlestick pattern criteria for displaying candles on charts. The remaining parameters allow traders to position the candlestick pattern labels on their charts and allows traders to decide which of the 20 Swing Reversal Candlestick patterns to track and trade.
Get the TOP Swing Reversal Candles Advantage Today!
Both new traders and professional traders alike can benefit from the power of the TOP Swing Reversal Candles indicator for day trading, swing trading, and trend trading. The TOP Swing Reversal Candles indicator can be used to trade Stocks, Bonds, ETFs, Options, Futures, and FOREX. Now you can potentially confirm market tops and bottoms better with the TOP Swing Reversal Candles indicator.