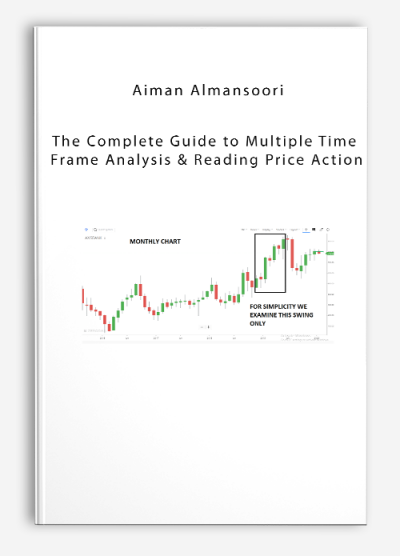
Aiman Almansoori – The Complete Guide to Multiple Time Frame Analysis & Reading Price Action
$252.00
- Description
Description
Aiman Almansoori – The Complete Guide to Multiple Time Frame Analysis & Reading Price Action
Interpreting price action through multiple time frames, ranging from the weekly chart down to the 1-minute chart, is comprehensively addressed in The Complete Guide to Multiple Time Frame Analysis & Reading Price Action. Irrespective of the trading strategy or indicators employed, day traders must possess the skill of reading price action and analyzing multiple time frames. The ability to anticipate market direction and pinpoint crucial entry levels typically evolves after countless hours of screen time and diligent practice. This course encompasses all the necessary resources to expedite the learning process and enhance your proficiency in chart analysis.
Aiman Almansoori, who is he?
Dr. Aiman Al-mansoori holds a senior trading position at Peak Capital Trading. Aiman embarked on his trading career in 2017 and joined Peak Capital Trading in 2021. Aiman’s guidance has benefited over a hundred active traders, with many achieving sustained success. Presently, Aiman serves as a full-time trader at the proprietary firm, where he aids aspiring traders in defining their unique advantages and trading styles. Previously, only a select group of traders at Peak Capital Trading and a limited number of his mentees had access to the proprietary trading strategies he imparts in his Trading Terminal Academy courses.
The Complete Guide to Multiple Time Frame Analysis & Reading Price Action with Aiman Almansoori
We will assist you in unlocking your inner potential to excel in your professional domain. Some advantages of our training include:
- Recognition of entry and target zones
- Anticipation of market ranges, accumulation, and distribution phases before their occurrence
- Employing the pinpoint strategy for astute entries during market dips
- Navigating turbulent market phases by recognizing their onset
- Incorporating various methods and strategies to enhance a winning position
- Establishing entry criteria utilizing the 1-minute chart for optimal entry points

