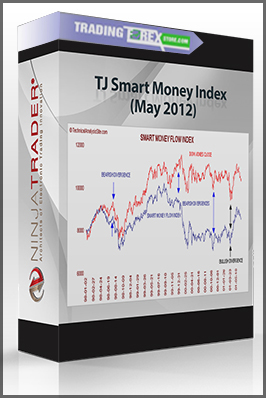
TJ Smart Money Index (May 2012)
$49.00
Size 93.1 MB
You just pay $49
- Description
Description
believe the indicator was called the ‘large trader indicator’ or ‘smart money indicator’. It simply plotted a line over the chart, it could also have its own panel though.
The line graphed the activity of traders who traded large amounts of contracts (smart money). The line increased as ‘smart money’ traders were buying and decreased as they were selling. The indicator allowed the number of contracts per trade to be adjusted. So by making the number-of-contracts-per-trade number small the indicator could also plot the ‘dumb money’.
It is very interesting to see how the indicator shows that the ‘smart money’ traders buy at lows and sell at highs, and how ‘dumb money’ buys at highs and sells at lows.
It was very effective and informative because it also behaved as a leading indicator. One of the few that I have seen.

