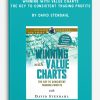
Winning with Value Charts – The Key to Consistent Trading Profits by David Stendahl
$17.00
- Description
Description
Winning with Value Charts – The Key to Consistent Trading Profits by David Stendahl
**More information:
Status:
Sale Page
Get Winning with Value Charts – The Key to Consistent Trading Profits at bestoftrader.com
Product Description
Discover winning new strategies, plus how to use 2 of the most powerful new trading indicators to come along in decades, in best-selling author David Stendahl’s thorough video workshop. Developing a sound, systematic trading approach has never been easier – or led to more consistent results – as you follow the six-step program Stendahl outlines. Then, learn to combine the trading plan with his refreshing new approach to chart reading using Value Charts and Price Action Profile. Stendahl has spent over 15 years perfecting this innovative analysis tool, and top name traders around the country have endorsed the concept. Now, you can learn every nuance, every detail needed to use Value Charts to your own trading advantage. Start “winning with Value Charts” today – as Stendahl shows you how to ditch your old “hit and miss” trading style, embrace a new, systematic style and perfect your market timing and risk management skills by adapting Value Charts to your own trading routine
Traders who leap from one trading idea to another rarely find long-term trading success. Now, trading system expert David Stendahl’s new video workshop gets you on the fast track to trading profits with breakthrough concepts and powerful new pattern recognition tools. First, Stendahl explains in-depth his six-step process for developing a systematic approach to trading that produces ongoing and consistent trading results. From system development and evaluation, to risk management and optimal portfolio construction – Stendahl’s 6-part program is both simple to grasp and easy to implement.
Then, he introduces an innovative new analysis technique that’s taking the trading world by storm: Value Charts and Price Action Profile. This refreshing new perspective to chart reading and market analysis has been heralded by veteran traders such as Larry McMillan, as it provides a better “read” on the markets and, thereby, your best chance at precise market timing and increased market profits. Expanding on concepts first outlined in his best-selling book, Dynamic Trading Indicators, Stendahl goes one-on-one with you to illustrate how Value Charts can give active traders a true trading edge.
With dozens of charts and real-world examples included in the online companion manual, this powerful presentation offers you …
– Hands-on methods to better manage your trades
– Detailed explanation for using Value Charts to determine bullish and bearish divergences
– Easy applications for incorporating value charts into a sound trading system
– Keys to using Value Charts as a trading filter, a positioning strategy and other techniques for trading all markets with increased confidence, decreased risk and the ongoing success.
Improve your profit potential significantly as you move from a “hit-and-miss” trading style to a systematic approach that includes two powerful and precise new technical indicators in the mix.
Technical Analysis Day trading
How to understand about technical analysis: Learn about technical analysis
In finance, technical analysis is an analysis methodology for forecasting the direction of prices through the study of past market data, primarily price and volume.
Behavioral economics and quantitative analysis use many of the same tools of technical analysis, which,
being an aspect of active management, stands in contradiction to much of modern portfolio theory.
The efficacy of both technical and fundamental analysis is disputed by the efficient-market hypothesis, which states that stock market prices are essentially unpredictable.