Volume Profile Range Indicator
$19.00
- Description
Description
Volume Profile Range Indicator
Archive : Volume Profile Range Indicator
Volume profile (VP) is one of the most important and useful indicators in technical analysis. It displays three basic variables (price, volume and time) in one chart, which made it more straightforward to read for both professionals and beginners. Users can easily spot volume at a specific price level in a given timeframe.
This MT4 indicator is able to show the tick volume profile in a given range with many advanced features. Some key supply and demand (supply or demand) levels at a specific price range become more obvious by using this indicator.
How it works?
The Volume profile is plotted as horizontal histogram on chart at the same level of the price traded.
Each VP bar represents the total tick volume for the price at the same horizontal level.
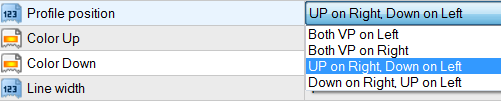
Both UP/positive and DOWN/negative volume starts from the same point, it’s either the right side or the left side of the chart window depends on your input choice.
Note that this VP indicator will not show the Volume Profile of every trading session.
Features and Inputs:
- It works on all timeframes.
- Tag, if you apply two instance of this indicator on the same chart, make sure you use different tag for each of them.
- Bar Range: Adjust a particular number of bars on chart to show the total amount of tick volume profile. If you set 50, the indicator will display the tick volume profile for the latest 50 bars. Users can increase or decrease this number to suit their preferences.
- Profile width, the maximum width of the VP allowed on chart.
- Profile style, there are two of them which are Rectangle and line.
- Profile position, there are 4 options for you to choose.
- Color Up, the color for UP/positive VP bar.
- Color Down, the color for down/negative VP bar.
Note that volume is down/negative when the close price moves down, Volume is up/positive when the close price moves up. - Line width, this only apply to Line style, if you chose Rectangle there will be no effect.
- Show POC (Max Vol level Line) , enable/disable the line for the Max VP level.
The color of POC line is the same as the corresponding VP bar. - Max level line width and style inputs control the property of POC line .
- VP Start line highlights where the VP bars begin, if Bar Range=100 a vertical line will be drawn at 100 bars ago from the latest(current) bar on chart. If there is a new bar generated on chart the VP Start line will be redrawn at one bar on its right side.
VP Start line color and style inputs control the property of VP Start line.
If you chose to display both VP on the same side with Rectangle style, their color will overlap.
In the chart below, Down/negative volume is set to red color and UP/positive volume is green color. When there is more Down/negative volume than UP/positive volume at the same level, the positive volume color will be shown as yellow bar, and vice versa.
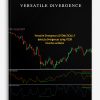
If you want to check the Volume profile for both short and long range, you can use one indicator with a small range input and another one with a large range. The chart below has two VP indicators, the left side one has a larger value of Volume profile input, it starts from the cyan line. The right side one has a smaller value of Volume profile input, it starts from the yellow line.
The POC (Max VP level Line) is very useful in detecting and estimating current and future support and resistance levels.
It is important to confirm VP with other indicators and analysis techniques, chart patterns and divergence are good complements to it.
The following videos show how it works in realtime. You will get better ideas of how the indicator react to different inputs.
Get Volume Profile Range Indicator on bestoftrader.com
Volume Profile Range Indicator Download, Volume Profile Range Indicator Download, Volume Profile Range Indicator Groupbuy, Volume Profile Range Indicator Free, Volume Profile Range Indicator Torrent, Volume Profile Range Indicator Course Download, Volume Profile Range Indicator Review, Volume Profile Range Indicator Review