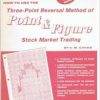
Three Point Reversal Method of Point & Figure Stock Market Trading by A.W.Cohen

$22.00
Product Include:
File size:
- Description
Description
Three Point Reversal Method of Point & Figure Stock Market Trading by A.W.Cohen
Stock trading course: Learn about Stock trading
A stock trader or equity trader or share trader is a person or company involved in trading equity securities.
Stock traders may be an agent, hedger, arbitrageur, speculator, stockbroker.
Such equity trading in large publicly traded companies may be through a stock exchange.
Stock shares in smaller public companies may be bought and sold in over-the-counter (OTC) markets.
Stock traders can trade on their own account, called proprietary trading, or through an agent authorized to buy and sell on the owner’s behalf.
Trading through an agent is usually through a stockbroker. Agents are paid a commission for performing the trade.
Major stock exchanges have market makers who help limit price variation (volatility) by buying and selling a particular company’s shares on their own behalf and also on behalf of other clients.
size 11.6 MB
Description: Chartcraft, Inc., Larchmont, NY, 1982. Soft cover. Book Condition: Very Good. 4to – over 9¾ – 12″ tall. Softcover, Trade Paperback, printed wrappers with red title to cover and spine with red and white graphics to cover, Revised Eighth Edition, 1982. Book Condition: Very Good, covers lightly rubbed, corners gently bumped, slight fading to spine, light shelfwear, internally near fine, pages clean and bright, no marks, Contents: Foreword, Introduction, Section One – The Point & Figure Chart and Construction, The Point and Figure Chart, Charting A Very Low-Priced Stock, Chart Construction, Section Two: Chart Patterns, The Double Top & Double Bottom Formation (#1 & #2), The Bullish Signal Formation, The Bearish Signal Formation, The Bullish & Bearish Symmetrical Triangles, The Triple Top Formation, The Triple Bottom Formation, Formations in Combination, Variations onThe Triple Top & Bottom Formations, Bullish & Bearish Catapult Formations, The Bearish & Bullish Signal Reversed Formations, Section Three – Trend Lines, The Bullish Support Line, The Bullish Resistance Line, The Bearish Resistance Line, The Bearish Support Line, Section Four – Price Objectives, The Horizontal Count, The Vertical Count, The Horizontal & Vertical Count, Section Five – Relative Strength, Section Six – Industrial Groups, Section Seven – The Dow-Jones Industrial Average, Section Eight – Trading Tactics, Establishing the Trade, Profitability Tables, The Pullback, Stoploss Orders, Taking Profits, Stocks With A High Short Interest, Section Nine – Convertible Bonds, Section Ten- Over-The-Counters, Section Eleven – Technical Indicators, The Cumulative Daily Advance-Decline Line, The High-Low Index, The On-Balance Volume Index, The Odd-Lot Balance Index, The 10-Day Advance-Decline Ratio, The 10-Day Upside-Downside Volume Ratio, The 200-Day DJIA Momentum Index, The Index of Speculative Confidence, The Gold Mining Disparity Index, The Short Interest Ratio, The % of NYSE Stocks Above Their 10-Week Moving Average, The 10-Week Most Active Stocks Ratio, The NYSE Bullish Percentage, The DJIA Bullish Percentage, General Motors as a Bellwether Stock, Section Twelve – Puts and Calls, Section Thirteen – Commodities, Section Fourteen – Adjusting a Chart for a Stock Split, Section Fifteen – The 5-Point Reversal Chart — end. — Scarce in this condition, Collectible. Bookseller Inventory # 000606
Get Three Point Reversal Method of Point & Figure Stock Market Trading by A.W.Cohen at bestoftrader.com