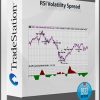
RSI Volatility Spread
$19.00
Size: 935 KB
You Just Pay: $19
- Description
Description
Summary
Average true range is often used as an indication of a security’s volatility. Although the raw number alone does not imply high or low volatility, plotting the historical average true range of a security allows you to view where volatility was decreasing, increasing, or reaching a peak or a trough. In this paper, I will introduce an indicator and strategy that try to take advantage of the increased trading opportunities that occur during times of higher- or lower-than-average volatility for a stock when compared to the overall market. This is accomplished by comparing the relative strength index (RSI) of the average true range (ATR) of a specific stock to the relative strength index of the average true range of the overall market.
Calculation
In order to standardize the average true range of the security and the overall market, the indicator calculates the RSI of the ATR. This helps standardize the changes in ATR of the overall market versus the changes in ATR of a stock. The RSI of the ATR is calculated on both the ATR of the overall market and the ATR of the security you want to trade. Once both RSIs are calculated, the RSI spread is determined by dividing the RSI ATR calculation of the tradeable security by the RSI ATR calculation of the market. We then take an average of the RSI spread and look for trading opportunities by finding occurrences in which the current RSI spread is greater or less than the average RSI spread. If the RSI spread is above its average, then the tradeable security is currently experiencing higher volatility than normally experienced when compared to the market. This is a bearish signal and the strategy will correspondingly sell. If the RSI spread is below its average, then the tradeable security is currently experiencing lower volatility than normally experienced when compared to the market. This is a bullish signal and the strategy will correspondingly buy.
To demonstrate the RSI Volatility Spread, I will introduce several indicators that plot the RSI spread idea, as well as a strategy that uses the indicator’s results to generate buy and sell signals. The strategy works well on several international market exchange-traded funds (ETFs) as well as other sector ETFs. For demonstration purposes, I will present the strategy’s results on the iShares MSCI Australia Index. However, I will also present a summary of results for several other ETFs in the Portfolio Spotlight section. In Figure 1 below, you can view several strategy sample trades along with the accompanying indicator that is plotting the average RSI spread difference. When the average spread difference is above zero –signifying higher volatility– the histogram color is red to identify a bearish outlook. When the average spread difference is below zero –signifying lower volatility– the histogram color is green to identify a bullish outlook.
Strategy Strengths
The strategy’s profit factor of 4.52 signifies that for every $1.00 lost, $4.52 was earned in profit.
The return on account — 742.45% over the approximately 19 years that the strategy was back-tested — far exceeded the buy-and-hold return of 164.71% (generated by simply buying at the beginning of the testing period and holding the security).
The K-ratio, which is a risk-adjusted performance measure, is 3.89. The higher the K-ratio, the better the strategy in terms of risk-adjusted performance. The industry standard is 2.50.
The strategy’s weekly underwater equity of (-15.64%) is much better than that seen under the buy-and-hold strategy of the security (-68.25%).
Average profit by month was positive 9 of 12 months, with January being the worst-performing month.
The detailed equity curve is fairly linear over the 19 years that the strategy was back-tested. The strategy was back-tested over the entire period during which the security was tradeable.
Risk-adjusted performance is consistent across several ETFs, as presented in the Portfolio Spotlight table.
The net profit divided by maximum drawdown ratio was 5.06, signifying low drawdown during the back-test.
Strategy Weaknesses
Because the strategy is intermediate-term, it has a low number of total trades during the period (33). However, if the strategy were implemented on a portfolio of securities, the total number of trades would increase, allowing for more diversification and lower total risk.
The standard deviation of monthly return is 571% times the average monthly return, signifying higher risk in the strategy.
The last trade the strategy generated is currently a losing trade.
The strategy had negative annual returns in 7 of the 19 years it was back-tested, with 2008 being the worst-performing year (-8.20%).