iCinDER V2 Cycle Analysis and TrendGuide Pack and Bloodhound Ultimate (May 2015)
Original price was: $1,390.00.$79.00Current price is: $79.00.
Size 5.5 GB
- Description
Description
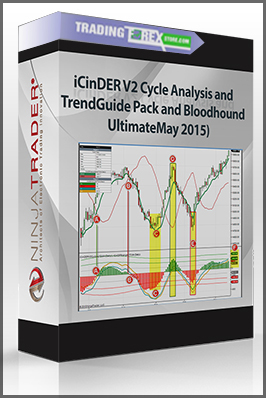
iCinDERTM V2 Cycles indicators (V2s, V2i and V2m) are velocity type of cycle indicators. On this same plot, the Ranger for V2 is also plotted.
The V2s, V2i and V2m travel in a cycle fashion (sine wave) from low extreme to high extreme. In our example, the (A) are shows a crossover from negative to positive — this is generally, the area of confirmation for a bullish bias. The marker (B) shows the V2s moving from positive to negative — this is generally, the area of confirmation for a bearish bias. The marker (C)(E) shows all 3 V2 cycles moving upward — again, this is a bullish bias and the reverse is also true — when the 3 cycles confirm a move downward, it indicates a bearish bias. (Marker (D).
Now, looking at Marker (F), you find that there are values associated with each of the V2 levels. The V2s level is actually red and sitting behind the value 132.99. These values are hard to see when you are also showing the Ranger values, we suggest to plot the Ranger values as transparent.
The values are as follows:
- V2s = 193
- V2i = 277.51
- V2m =238.74
What do these values mean or imply? For the minor cycle to cross zero it has to drop 193 points. For the Intermediate (V2i) cycle to cross zero, it has to drop 277.51 and for the Major cycle to cross zero, it has to drop 238.74. As the cycles approach the zero, they tend to get closer to each other when there is an actual reversal of trend. However, when only the V2s is above zero and the V2i and V2m remain below zero – the likely scenario is a balance area or consolidation.

