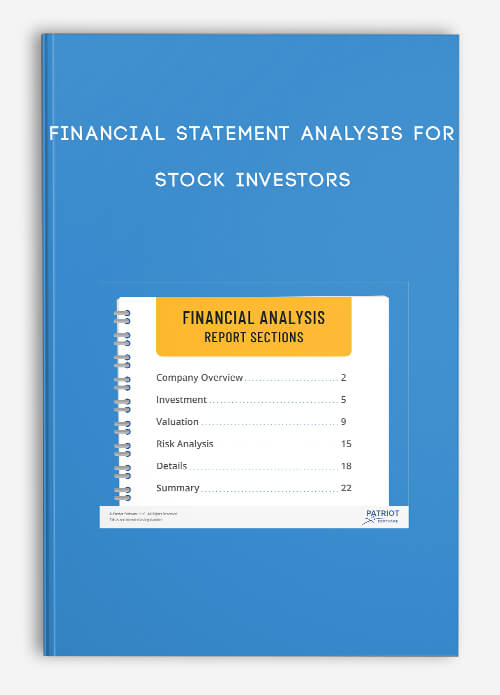
Financial Statement Analysis for Stock Investors
Original price was: $97.00.$35.00Current price is: $35.00.
Product Include:
File size:
- Description
Description
Financial Statement Analysis for Stock Investors
**More information:
Get Financial Statement Analysis for Stock Investors at bestoftrader.com
Description
It behooves investors to take advantage of the wealth of information provided in a company’s financial statements, in order to help them evaluate the company as a potential investment. In terms of overall profitability, the net income is the obvious starting point, when analyzing a financial statement. This bottom-line dollar amount on a company’s income statement is an excellent indicator of profitability because it puts a value on the amount a company takes in, once all costs of production, depreciation, tax, interest and other expenses have been deducted. However, net income shouldn’t be used exclusively, when evaluating a company.
Operating profit margin is another important indicator of profitability and efficiency. The operating profit margin compares the amount a company earns, before interest and taxes on sales are calculated. The margin helps analysts and potential investors gauge how successful company managers are at controlling expenses and generating revenue. A high operating profit margin strongly indicates that a company is shrewdly managing costs and generating sales.
Financial statements can be used to assess the company’s stock price and profitability for shareholders. A variety of metrics are useful in this process. Earnings per share (EPS) is an indicator of return on investment, showing a company’s per-share profitability. The price-earnings (P/E) ratio uses a stock’s EPS, compared to its present share price, for evaluation purposes. The price to book (P/B) ratio is considered a foundational value metric for investors, as it reveals the market’s valuation of the company, in relation to its intrinsic value.
The dividend payout ratio is another useful metric, that measures a company’s growth, financial stability and returns paid to stockholders. The dividend payout ratio calculates the percentage of company earnings paid out to equity investors, in the form of dividends. The higher the ratio value, the more reliably a company’s earnings can sustain dividend payouts, and the more stable a company is considered to be. Retained earnings, the amount of profits not paid out to shareholders as dividends, shows what portion of profits a company is reinvesting in expanding its business.
The breakdown of assets and liabilities contained on a company’s balance sheet provides investors with a reliable snapshot of the company’s overall financial health, as well as its debt situation. Debt ratios, such as the current ratio, which can be calculated from the information provided in financial statements, let analysts assess a company’s ability to handle outstanding debt. Major capital expenditures can be used in evaluating a company’s current financial condition and can telegraph the potential for growth.
Sponsored
Compete Risk Free with $100,000 in Virtual Cash
Put your trading skills to the test with our FREE Stock Simulator. Compete with thousands of Investopedia traders and trade your way to the top! Submit trades in a virtual environment before you start risking your own money. Practice trading strategies so that when you’re ready to enter the real market, you’ve had the practice you need.
Forex Trading – Foreign Exchange Course
Want to learn about Forex?
Foreign exchange, or forex, is the conversion of one country’s currency into another.
In a free economy, a country’s currency is valued according to the laws of supply and demand.
In other words, a currency’s value can be pegged to another country’s currency, such as the U.S. dollar, or even to a basket of currencies.
A country’s currency value may also be set by the country’s government.
However, most countries float their currencies freely against those of other countries, which keeps them in constant fluctuation.

