- Description
Description
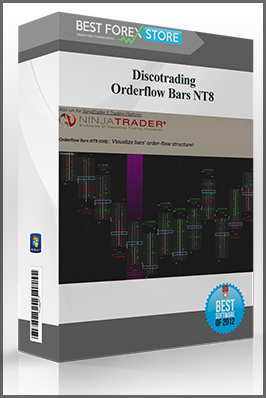
Discotrading – Orderflow Bars NT8
Sale Page : discotrading
This product is available
You can refer to the screenshots here :
Please contact us to get free sample
I. Add-on Installation/Updatel.
- Install downloaded assembly:
- Go to “Tools” → “Import” → “NinjaScript Add-On…”, select downloaded .zip file and press “Open”. Then if the installation was correct you will see the success message.
- Restart NinjaTrader!
Note: Various Dt add-ons are relying on the same “DiscoTrading.Common.dll” library. NinjaScript Assembly contains the most recent version of the library, so you have to click ‘Yes’ when asked for replacement of the file during installation.
Remember, it is required to restart NinjaTrader after add-on installation before you can add a just installed indicator to a chart.
II. Initial Chart Configuration
Here you can find some basic advice about initial setting up of a chart with Orderflow Bars NT8.
2. Then restart NinjaTrader. The new workspace will be available to load in Workspaces menu of NinjaTrader Control Center.
(We chose Workspaces instead of Chart Templates because Chart Templates may not carry all chart appearance settings that are needed. Afterwards you may load the attached workspace and save chart settings as Chart Templates on your own, if necessary.)
Step One
First of all, it may be necessary to swap relative position (z-order) of Price Bars and Indicator’s output to avoid their overlapping.
First Way: Use a standard way in NinjaTrader — select candlestick series, hold down Ctrl key and scroll mouse wheel. This way does not work sometimes. Thus you can use alternate way — a special command from OfB Control Panel.
Alternate Way: Click ‘OfB’ button in chart’s toolbar to open OfB Control Panel. In the control panel appeared click ‘Z-Order: Send to Back’/‘Bring to Front’ button until you get indicator’s output over price bars.
Step Two
Secondly, you may need to increase price Bars Spacing and decrease Bars Width to get a suitable look of orderflow bars
Increase the Bar Spacing by using the [Ctrl + Down arrow key] keyboard shortcut or use Left Mouse Click in the X-axis margin and move the mouse cursor to the left or right to adjust horizontal scale.
Decrease the Bar Width by using the [Alt + Up Arrow] shortcut key or the “Bar Width -“ command from chart’s toolbar menu:
Step Three
You may also need to increase the “Right side margin” parameter in Chart’s properties window to add more space for the current (developing) bar. This may be especially necessary if having Pullback Bar enabled which is plotted next to the developing bar.
III. Overview
OfB Control Panel
OfB Control Panel provides quick access to high-usage properties and switchers in such a way that any changes will take immediate effect on chart so you no more need to get into “Indicators” settings window.
Appearance Modes
Various representation ways of ticks or volume distribution + various highlighting ways of ‘buying vs selling’ imbalance:
Simplified Look
Developing Bar Extra Information
Supplementary information on current auction (Pullback Bar; Δ since New High & New Low of the developing bar):
Data Table
All major metrics + functional coloring:
Conditional Marks
Highlight bars or even particular price ticks that match defined conditions:
Bars Types Compatibility
There are special Bars Types (Period Types) which have a specific impact on the data flow in NinjaTrader (most of the Renko, Point and Figure, Line Break, for example) that makes them be unsuitable to use with order-flow tools. These “bars types” are actually self-sufficient studies!
Such kind of bars types (some of them internally use Ninja’s RemoveLastBar() function) tend to produce bars with fake data (at least partially): fake bar open, fake bar high, fake close, fake volume… For example, a price bar built based on some kind of Point and Figure or Renko technique may vary considerably from actual price action occurred on the market during the time of evolving of the bar. Moreover, developing (current) bar may have even bigger volume than after it becomes a historical bar (when new bar is coming). As a new bar is built it can take ticks away from a previous bar. This may be called as ‘inconsistent’ way to build bars, and this is a main problem of using of such period types with order-flow tools, especially when it comes to processing of live data. Thus these types are incompatible with NinjaTrader’s Tick Replay feature either.
Orderflow Bars NT8 constantly performs a basic check of incoming real-time data for consistency and stop working when data inconsistency is detected to prevent showing of unfair data.
The building of the common bars types like Range, Tick, Volume or Time bars are based on consistent, simple and clear logic. Those bars types are compatible with Ninja’s Tick Replay feature as well as with the majority of 3-rd party indicators as opposed to the most of Renko bars types, for example.
The most of the Renko-bar types, Point and Figure Charting and LineBreak Charting may be excellent tools on on their own — all these bars types are actually self-sufficient trading tools, studies, and they should not be used in conjunction with order-flow tools on the same chart just because of the nature of how they are built.
IV. General Parameters
- Data Source. Sets the way of gathering historical 1-tick data (data of tick-level granularity).
Orderflow Bars NT8 indicator needs some time to read and prepare tick data on start up. Set feasible amount of ‘Days to load’ for your chart to reduce the loading time on start up.
- Tick Series (default) — this mode internally utilizes the most generic and native way of obtaining tick data in NinjaTrader.
The Tick Replay mode should be disabled for primary input Data Series.
Tick Replay — is a new way of obtaining historical 1-tick data introduced in NinjaTrader 8. In the Tick Replay mode NinjaTrader playbacks historical ticks (tick by tick) to build bars as if they had been build live. In order to use this feature it must be manually enabled on the primary Data Series in the Data Series settings window.The both Data Sources are equal in terms of accuracy. The “Tick Replay” option is presented in OfB indicator for compatibility reasons as some 3-rd party indicators may require Tick Replay feature be enabled in order to obtain tick data. For example, if you use OfB and some other indicator which works only in Tick Replay mode on the same chart then you have to switch the OfB’s Data Source option to “Tick Replay” either.
- Tick Series (default) — this mode internally utilizes the most generic and native way of obtaining tick data in NinjaTrader.
- Base Metric.
- Volume — number of contracts (stocks, lots). The Volume-based Delta is defined as “Buying Volume” minus “Selling Volume”.*
- Ticks — number of trades. The Tick-based Delta is defined as “Number of Buying Trades” minus “Number of Selling Trades”.*
*Every trade always has two participants — buyer and seller. Thus the “Buying…” and “Selling…” are the terms related to initiative side which is defined by Delta estimation technique such as “Bid vs Ask” or “Up Tick vs Down Tick” (read the description of the ‘Delta Mode’ parameter).
- Delta Mode. In order to a trade take place two participants are required — buyer and seller. Thus both sides (Buying and Selling) do always participate in every trade. The phrase “Trade Side” is just a term serving to define which side (Buyer or Seller) is the initiator of the trade. The Trade Side defines the sign (+/-) of Delta value of that particular trade therefore:
Delta = “Buying” Volume or Ticks minus “Selling” Volume or Ticks.The Delta, in turn, is a way to estimate the level of aggressiveness of each side on the most basic level. However it is not a direct way as you may think, because you should always compare the Delta against related Price Action to define actual aggressor conqueror (sometimes a passive side who uses solely limit orders behave more aggressive and drive the Market in contrary to the diffused opinion). Moreover, the Delta analysis may be viable in a short-term period.There are two different ways to determine the initiative side and the Delta therefore:- Bid vs Ask technique. Who (Buyer or Seller) is the initiator of a trade is determined by comparing trade price with established Bid and Ask (Offer) prices at the trade moment. That is, Delta = Volume traded at Ask price minus Volume traded at Bid price.
- Up Tick vs Down Tick technique. “Buying” volume is the volume traded at Up Tick or after Up Tick and the “Selling” volume is the volume traded at Down Tick or after Down Tick and the Delta is the difference between them.
Since the volume- or tick- delta calculations are based on actually happened trades (fills) the both techniques will show true picture of what is transacting. The only what matters is which technique you are accustomed to. Many traders still only use the old good technique “Up Tick vs Down Tick” just because one is working for them. Do not use both at the same time when making trading decisions. Choose your ‘Delta Mode’ and stick with.
- Filter Mode. Mode of filtering by trade size.
- No Filtering (Default).
- Greater Than Or Equal. This mode forces the indicator to take into account only trades which have a size greater than or equal to the Fiter – Min Trade Size value.
- Less Than Or Equal. The indicator will only count trades with size not exceeding the Fiter – Max Trade Size value.
- In Between. The indicator will only count trades which have a size in the range from the Filter – Min Trade Size to the Filter – Max Trade Size inclusive.
- Ticks Per Row. Sets price ticks per row compression. Some futures contracts have very tiny Tick Size (minimal price step size) that can result in very dense ladders/histograms. The compression may help you to make the information more perceivable when working with instruments of such kind.
- Track View in Fixed Scale checkbox. Enables a special feature of view tracking in the ‘Fixed Scale’ mode in order to keep the current price within sight on the price chart.
V. Conditional Marks
Capping/Boosting Bars
‘Capping Marks’ serves to point bars where initiative trading activity maintaining established price swing (up or down) is steadily fading. That is, if buyers activity is steadily fading at some bar of upswing, then the bar will be marked.
‘Boosting Marks’ is an opposite concept to Capping. Just like climax bars which occur when the Delta increases from trending bar to bar and Delta also increases within the bar (from row to row). This would be interesting to mark the bars with opposite situation to the Capping situation.
There are two conditions of initiative activity fading detection in the OfB ‘Capping Marks’:
- Bar-To-Bar Fading — Detect fading of Delta from bar to bar of an established price swing;
- Row-To-Row Fading — Detect fading of buyers (in upward move) or sellers (in downward move) within bar from Row to Row (price ticks).
The ‘Capping Marks’ parameters are flexible so it is possible to mark the bars that satisfy only one of the criteria or both.
‘Row-To-Row Fading Tendency’ checkbox — check to enable the Row-To-Row Fading Tendency criterion — the decreasing from row to row of absolute value of chosen metric of initiative trading activity (Row Delta, Diagonal Imbalance, Bid or Ask contracts).
‘Row-To-Row Tendency Metric’ parameter allows to choose the metric of initiative trading activity to analyze for fading:
- ‘Row Delta’ — consider decreasing of simple horizontal Delta from row to row as “Capping” (Row Delta = Ask minus Bid).
- ‘Diagonal Imbalance’ — consider decreasing of Diagonal Imbalance from row to row as “Capping” (Diagonal Imbalance = 100% * [difference between crossing Ask and Bid] divided into [sum of the crossing Ask and Bid]).
- ‘Bid (in Downtrend) | Ask (in Uptrend)’ — consider decreasing of number of trades at Bid (in downward price swing) or number of trades at Ask (in upward price swing) as “Capping”.
‘Row-To-Row Fading Threshold’ parameter [0…100] sets the minimum required difference between rows in the value of chosen metric to consider that Fading Tendency is present.
Note
The Orderflow Bars is designed the way that all Threshold parameters are relative values (%), not absolute values (number of contracts, shares, lots…). This allows to use very similar parameters of the indicator with different instruments (futures, stocks, etc).
Thus, if the ‘Row-To-Row Tendency Metric’ is set to “Row Delta” then the [relative Delta difference between rows] is used instead of simple absolute difference to detect if fading tendency is present.
Relative Delta difference is calculated as the [difference of Delta values of two adjacent rows] divided into [average Volume of these two rows].
‘Num of Extreme Rows to Compare’ parameter sets the number of extreme rows of bar (starting from Top in the case of uptrend bar or starting from Bottom in the case of downtrend bar) to compare with each other by value of chosen metric.
Scanning the bars to find those that meet the Row-To-Row Fading Tendency criteria makes sense generally when there is an established directional price move (upswing or downswing).
‘Minimum of Trending Bars’ sets the minimum required number of trending bars.
• A bar is considered as trending Up if its High is higher and Low is inside the range of the previous bar.
• A bar is considered as trending Down if its Low is lower and High is inside the range of the previous bar.
‘Strict Trend Rule’ checkbox imposes additional constraints to consider a bar as trending bar:
• A bar is considered as trending Up if its High is higher the range of the previous bar and its Low is higher than the Low of the previous bar and its Close price is not lower than Close of the previous bar.
• A bar is considered as trending Down if its Low is lower the range of the previous bar and its High is lower than the High of the previous bar and its Close price is not higher than Close of the previous bar.
The option is disabled by default for ‘Capping Marks’.
‘Bar-To-Bar Delta Fading Tendency’ checkbox imposes additional requirement for defined number of consecutive trending bars to mark the last one as “Capping” bar. If checked then bar’s total Delta should fade from bar to bar (which means that initiative trading activity weakens from bar to bar).
‘Bar-To-Bar Delta Fading Threshold’ [0…100] — The more the Threshold the more difference in bar’s Delta is required in order to consider that the weakening tendency is present.
Get Discotrading – Orderflow Bars NT8 on bestoftrader.com
Discotrading, Orderflow Bars NT8, Download Orderflow Bars NT8, Free Orderflow Bars NT8, Orderflow Bars NT8 Torrent, Orderflow Bars NT8 Review, Orderflow Bars NT8 Groupbuy.

