AutoWave for ThinkorSwim Indicator TOS Script
$52.00
- Description
Description
 AutoWave for ThinkorSwim Indicator TOS Script
Product Description
AutoWave for ThinkorSwim
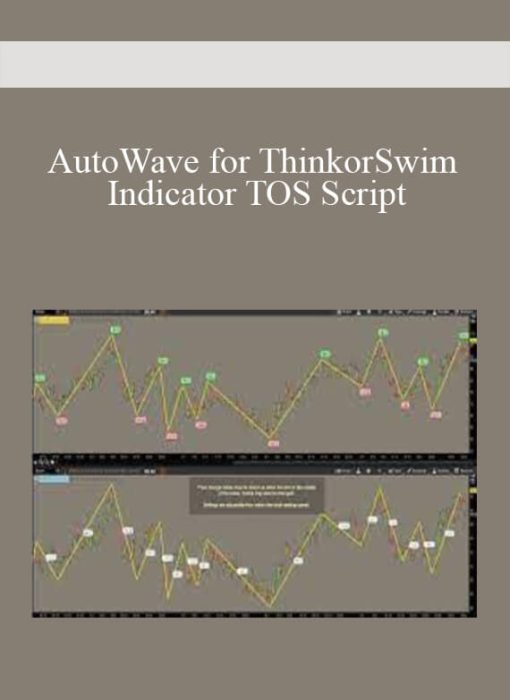
If the goal is to match QCharts AutoWave ZigZag functionality, then this is the only ThinkScript indicator for ThinkorSwim that does it.
AutoWave ZigZag for ThinkorSwim
Often requested, but never duplicated-until now!
This indicator duplicates the AutoWave ZigZag feature from QCharts.
But ThinkorSwim already has a ZigZag indicator.
Yes, it does; and it can get close to matching the QCharts AutoWave, but it cannot duplicate it. Take a look at the video below. After experimenting a great deal with the settings, the ZigZagHighLow can be made to closely match the AutoWave.
Everything looks great until the chart is scrolled back, or the symbol is changed, or the time-frame is changed. The ZigZagHighLow settings must be adjusted for each ticker symbol and every change made to the chart.
If the goal is to match QCharts AutoWave ZigZag functionality, then this is the only ThinkScript indicator for ThinkorSwim that does it.
The location and color of the price change labels may be adjusted from within the script settings panel.
technical analysis Day trading
How to understand about technical analysis: Learn about technical analysis
In finance, technical analysis is an analysis methodology for forecasting the direction of prices through the study of past market data, primarily price and volume.
Behavioral economics and quantitative analysis use many of the same tools of technical analysis, which,
being an aspect of active management, stands in contradiction to much of modern portfolio theory.
The efficacy of both technical and fundamental analysis is disputed by the efficient-market hypothesis, which states that stock market prices are essentially unpredictable.

